IVF statistics 2026: Germany, Austria, and Switzerland in numbers
In 2023, 21,673 children were born in Germany after IVF, ICSI, or frozen embryo transfer, roughly 1 in 32 children. In 2024, clinics reported 131,801 treatment cycles, more than ever before. The German IVF Registry has 142 member clinics. Also included are figures on assisted reproduction in Austria and Switzerland, drawn from registries, official statistics, and clinic lists, with every chart ready to share and embed.
- 131,801treatment cycles in German fertility clinics in 2024D·I·R Yearbook 2024
- 1 in 32children in Germany is born after IVF, ICSI, or frozen embryo transfer: 21,673 children out of 692,989 live births (2023, approximation)D·I·R, Destatis, own calculation
- 142fertility clinics in Germany are members of the German IVF Registry, plus 27 IVF Fund (IVF-Fonds) clinics in Austria and 32 in Switzerland (FIVNAT list)D·I·R, Austrian Federal Ministry of Social Affairs, SGRM, as of 2026
- 35.7 yearsis the average age of women in Germany when they have IVF or ICSI, and 36.8 years in SwitzerlandD·I·R 2024, Swiss Federal Statistical Office 2024
- 38%of IVF and ICSI treatments are due to a cause in the man alone, and another 26% to both partnersD·I·R Yearbook 2024
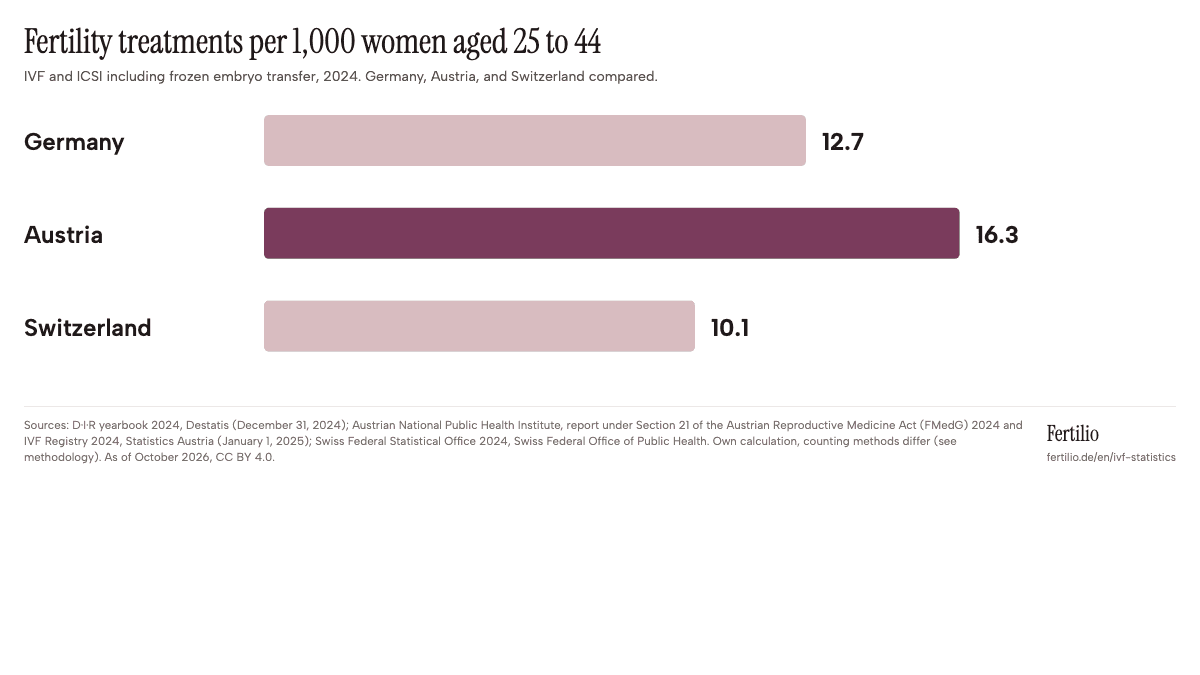
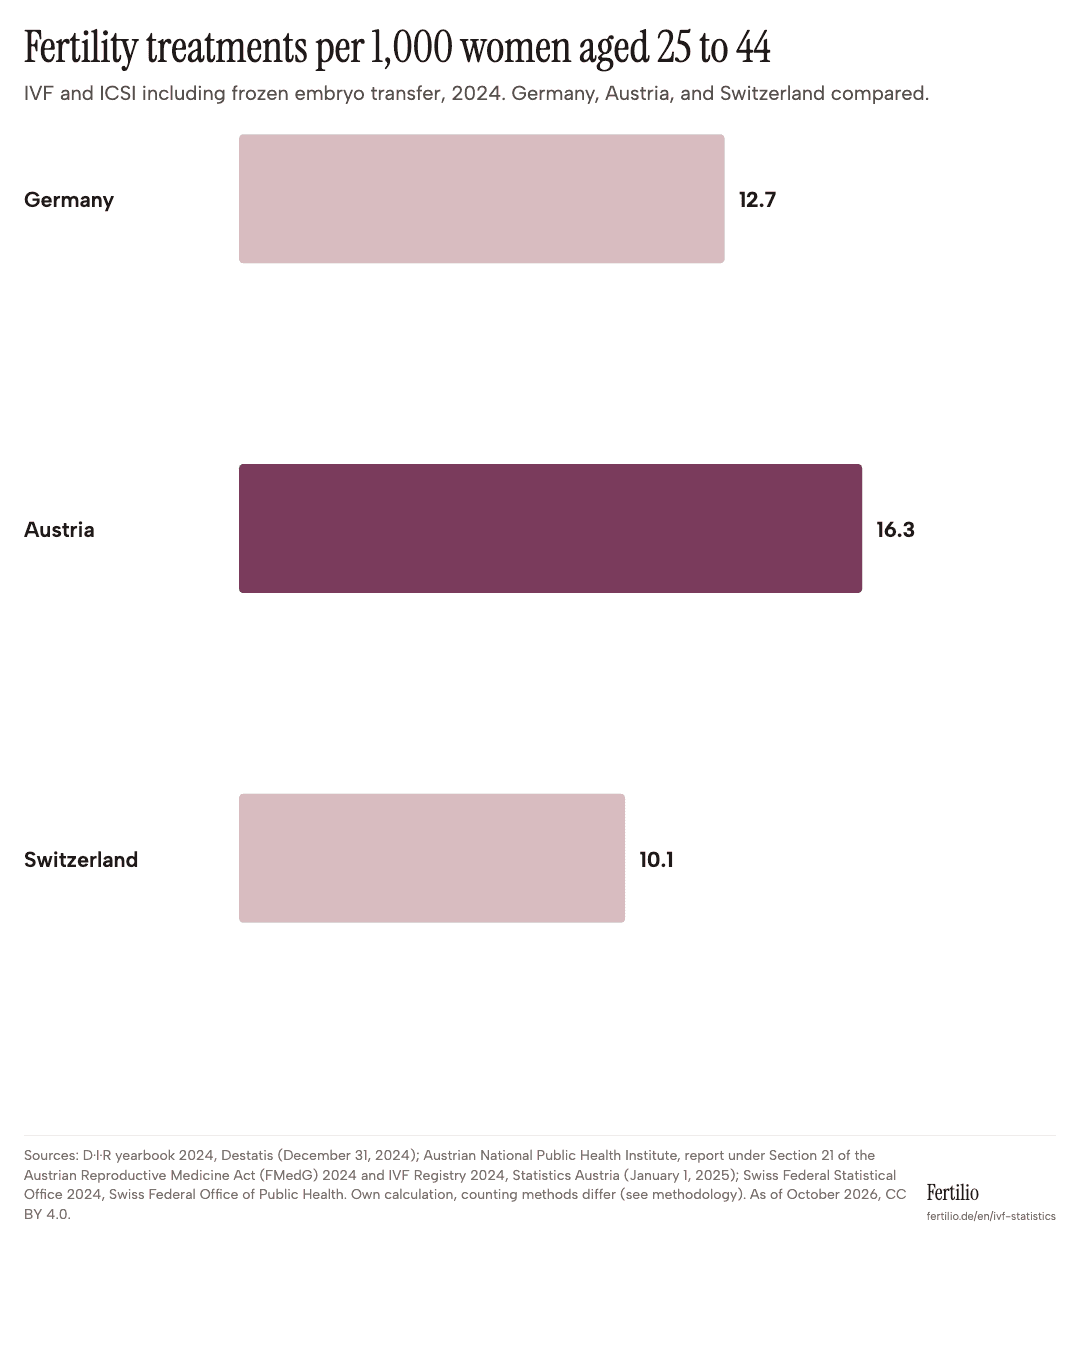
- 16.3treatments with IVF, ICSI, or frozen embryo transfer per 1,000 women aged 25 to 44 in Austria, 12.7 in Germany, 10.1 in SwitzerlandAustrian National Public Health Institute, D·I·R, Swiss Federal Statistical Office, Destatis, Statistics Austria, own calculation
Number of fertility clinics: 142 in Germany, unevenly distributed
In Germany, 142 fertility clinics are members of the German IVF Registry (Deutsches IVF-Register, D.I.R.), an average of 13.7 per million women between the ages of 25 and 44. They are distributed very unevenly. In Hamburg there are 27.6 clinics per million women in this age group, in Bremen 21.0, and in Berlin 20.7. In Brandenburg, a single clinic is listed in the registry for roughly 270,000 women (3.7 per million), in Thuringia the figure is 4.7, and in Mecklenburg-Western Pomerania it is 6.1.
Austria has 27 contract clinics of the IVF Fund (IVF-Fonds), 22.2 per million women. According to the FIVNAT list of the Swiss Society for Reproductive Medicine (SGRM), Switzerland has 32 clinics, 25.6 per million. Zurich has the most (7), followed by Basel-Stadt and St. Gallen (4 each). According to this list, 11 of 26 cantons have no IVF clinic of their own.
IVF centers per 1 million women aged 25 to 44
By federal state and canton. On average: Germany 13.7, Austria 22.2, Switzerland 25.6.
- no center
- under 10
- 10 to under 20
- 20 to under 30
- 30 to under 50
- 50 or more
All values as a table
| Region | Centers | Women 25 to 44 | per million |
|---|---|---|---|
| Basel-Stadt Switzerland | 4 | 33,002 | 121.2 |
| Zug Switzerland | 1 | 17,536 | 57.0 |
| St. Gallen Switzerland | 4 | 72,415 | 55.2 |
| Ticino Switzerland | 2 | 41,150 | 48.6 |
| Schwyz Switzerland | 1 | 21,310 | 46.9 |
| Salzburg Austria | 3 | 75,567 | 39.7 |
| Grisons Switzerland | 1 | 25,238 | 39.6 |
| Vorarlberg Austria | 2 | 53,285 | 37.5 |
| Lucerne Switzerland | 2 | 61,362 | 32.6 |
| Carinthia Austria | 2 | 66,570 | 30.0 |
| Burgenland Austria | 1 | 33,534 | 29.8 |
| Zurich Switzerland | 7 | 246,696 | 28.4 |
| Hamburg Germany | 8 | 290,085 | 27.6 |
| Solothurn Switzerland | 1 | 37,789 | 26.5 |
| Thurgau Switzerland | 1 | 39,535 | 25.3 |
| Geneva Switzerland | 2 | 79,738 | 25.1 |
| Styria Austria | 4 | 159,832 | 25.0 |
| Bremen Germany | 2 | 95,230 | 21.0 |
| Berlin Germany | 12 | 579,215 | 20.7 |
| Upper Austria Austria | 4 | 194,276 | 20.6 |
| Fribourg Switzerland | 1 | 48,801 | 20.5 |
| Lower Austria Austria | 4 | 206,496 | 19.4 |
| Tyrol Austria | 2 | 104,305 | 19.2 |
| Saarland Germany | 2 | 118,787 | 16.8 |
| Vaud Switzerland | 2 | 123,221 | 16.2 |
| Vienna Austria | 5 | 319,662 | 15.6 |
| Schleswig-Holstein Germany | 5 | 346,241 | 14.4 |
| Bavaria Germany | 24 | 1,684,040 | 14.3 |
| Baden-Württemberg Germany | 20 | 1,417,417 | 14.1 |
| Bern Switzerland | 2 | 141,381 | 14.1 |
| Saxony-Anhalt Germany | 3 | 218,793 | 13.7 |
| Saxony Germany | 6 | 445,779 | 13.5 |
| North Rhine-Westphalia Germany | 30 | 2,253,991 | 13.3 |
| Hesse Germany | 10 | 794,837 | 12.6 |
| Rhineland-Palatinate Germany | 6 | 494,834 | 12.1 |
| Lower Saxony Germany | 11 | 951,378 | 11.6 |
| Aargau Switzerland | 1 | 99,675 | 10.0 |
| Mecklenburg-Western Pomerania Germany | 1 | 163,749 | 6.1 |
| Thuringia Germany | 1 | 213,693 | 4.7 |
| Brandenburg Germany | 1 | 270,454 | 3.7 |
| Uri Switzerland | 0 | 4,558 | 0.0 |
| Obwalden Switzerland | 0 | 4,831 | 0.0 |
| Nidwalden Switzerland | 0 | 5,432 | 0.0 |
| Glarus Switzerland | 0 | 5,357 | 0.0 |
| Basel-Landschaft Switzerland | 0 | 36,910 | 0.0 |
| Schaffhausen Switzerland | 0 | 11,578 | 0.0 |
| Appenzell Ausserrhoden Switzerland | 0 | 6,921 | 0.0 |
| Appenzell Innerrhoden Switzerland | 0 | 2,009 | 0.0 |
| Valais Switzerland | 0 | 49,679 | 0.0 |
| Neuchâtel Switzerland | 0 | 23,812 | 0.0 |
| Jura Switzerland | 0 | 8,855 | 0.0 |
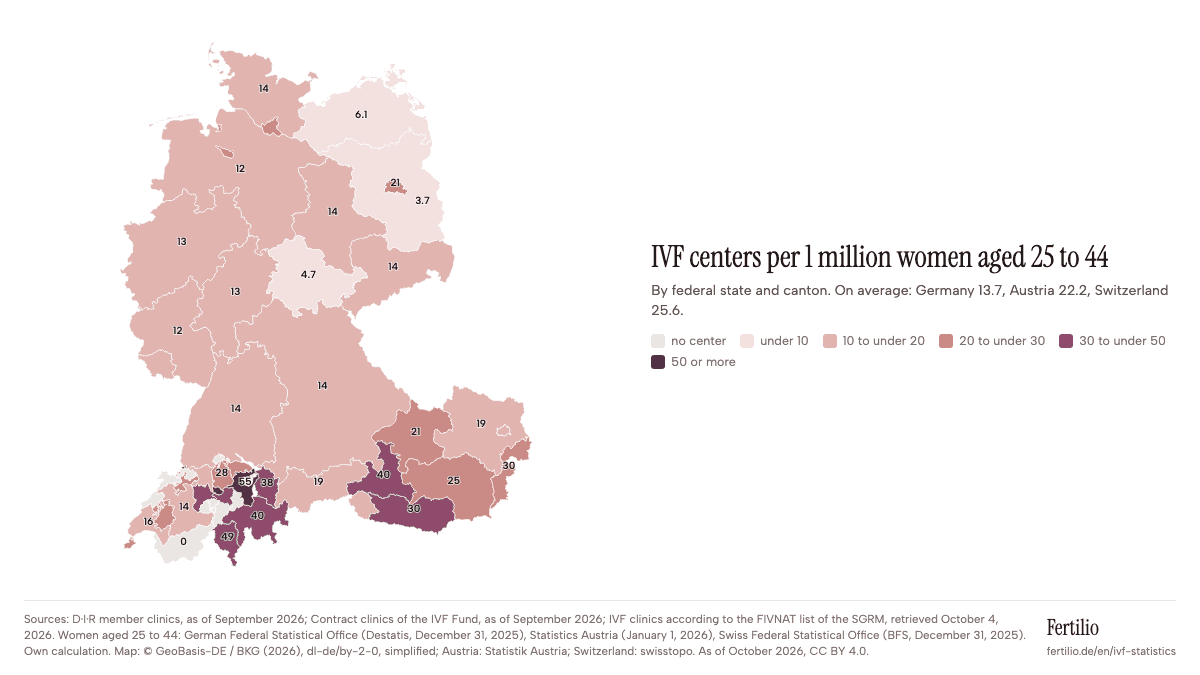
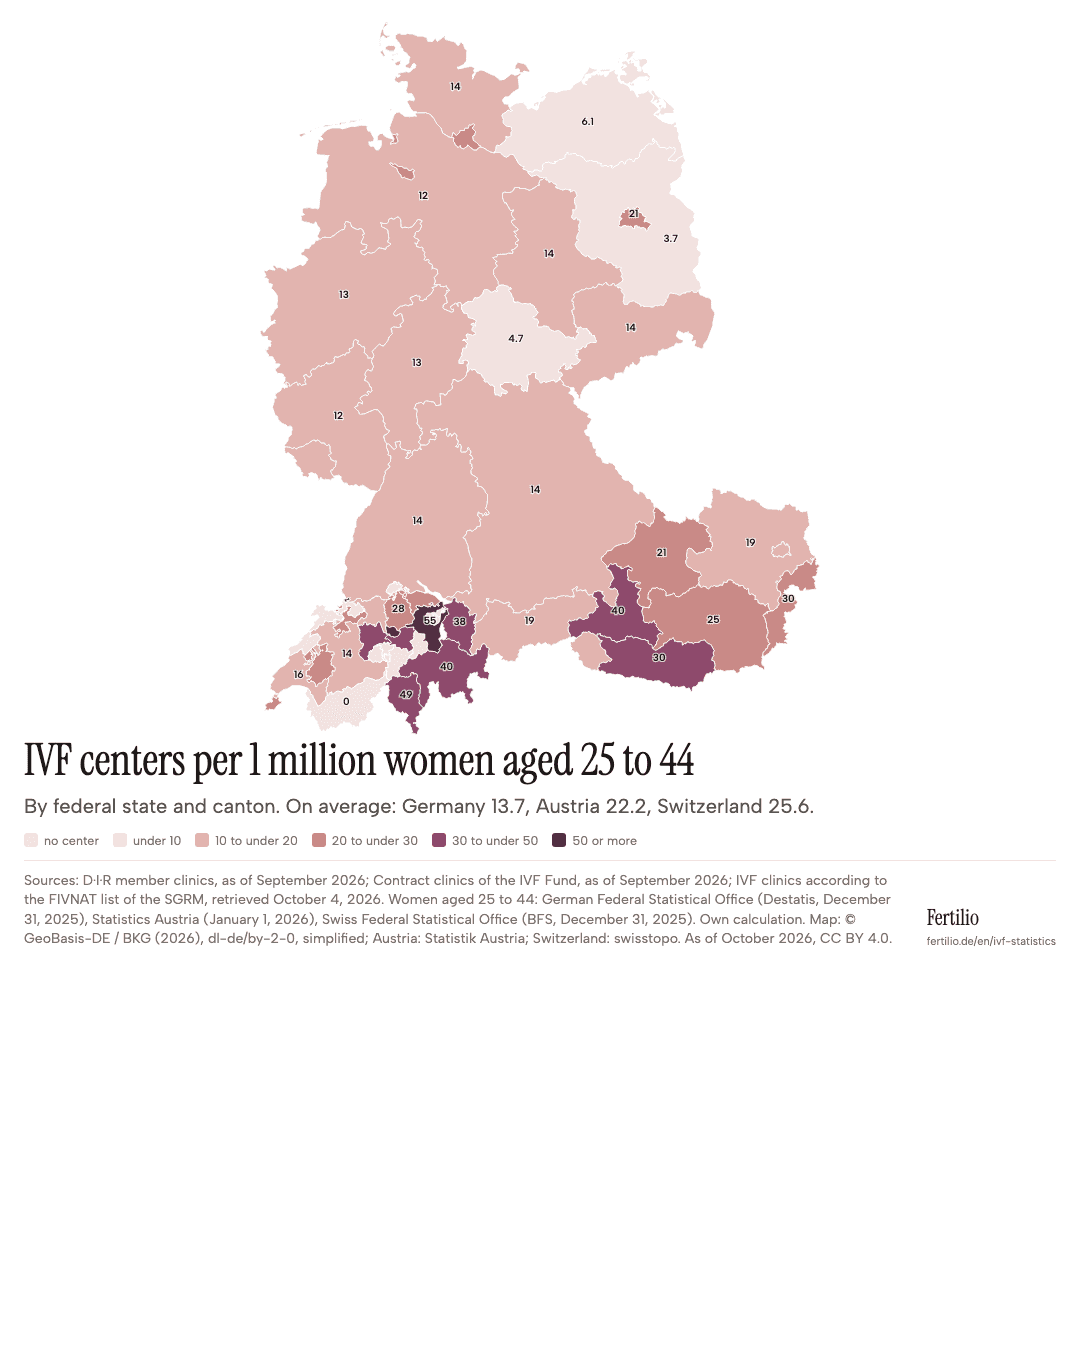
Density says nothing about the quality of individual clinics, nor about where couples are actually treated. Couples can also be treated in another federal state or in a neighboring country, for example in Berlin for couples from Brandenburg. How clinics are counted differs from country to country: in Germany, the entries on the D.I.R. member list are counted (each location individually), in Austria the contracted facilities of the IVF Fund (clinics without an IVF Fund contract are missing), and in Switzerland the FIVNAT list of the SGRM. You can find fertility clinics near you in our clinic directory. It contains more entries because it also lists practices and locations that are not members of the registry.
1 in 32 children in Germany born after IVF, ICSI, or frozen embryo transfer
For 2023, the German IVF Registry documented 21,673 children born after IVF, ICSI, or the transfer of frozen embryos. In the same year, 692,989 children were born alive in Germany. That corresponds to about 3.1%, or roughly 1 in 32 children. This is an approximation: the registry counts the children from the treatments of one year, and some of them are not born until the following year. In addition, only 94.9% of pregnancy outcomes were documented for 2023. Since 1997, the registry has recorded 433,858 children born after IVF, ICSI, or frozen embryo transfer.
Children born after IVF, ICSI, and frozen embryo transfer in Germany
Per year, 1997 to 2023. Most recently 21,673 children, around one in 32.
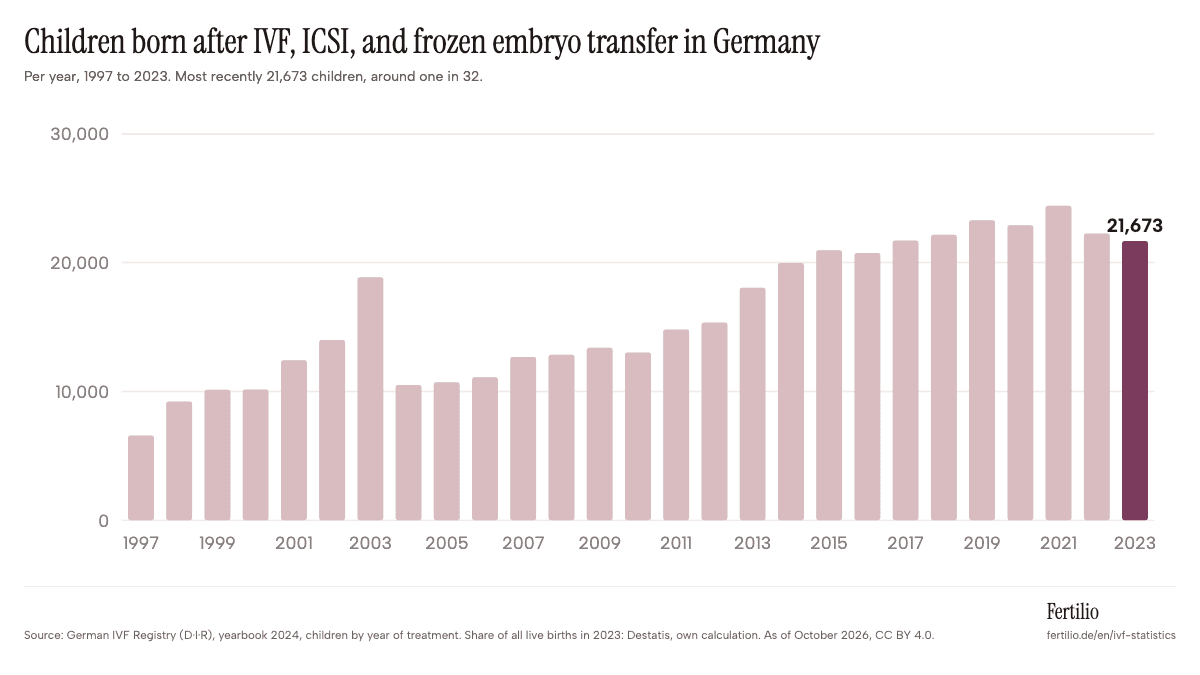
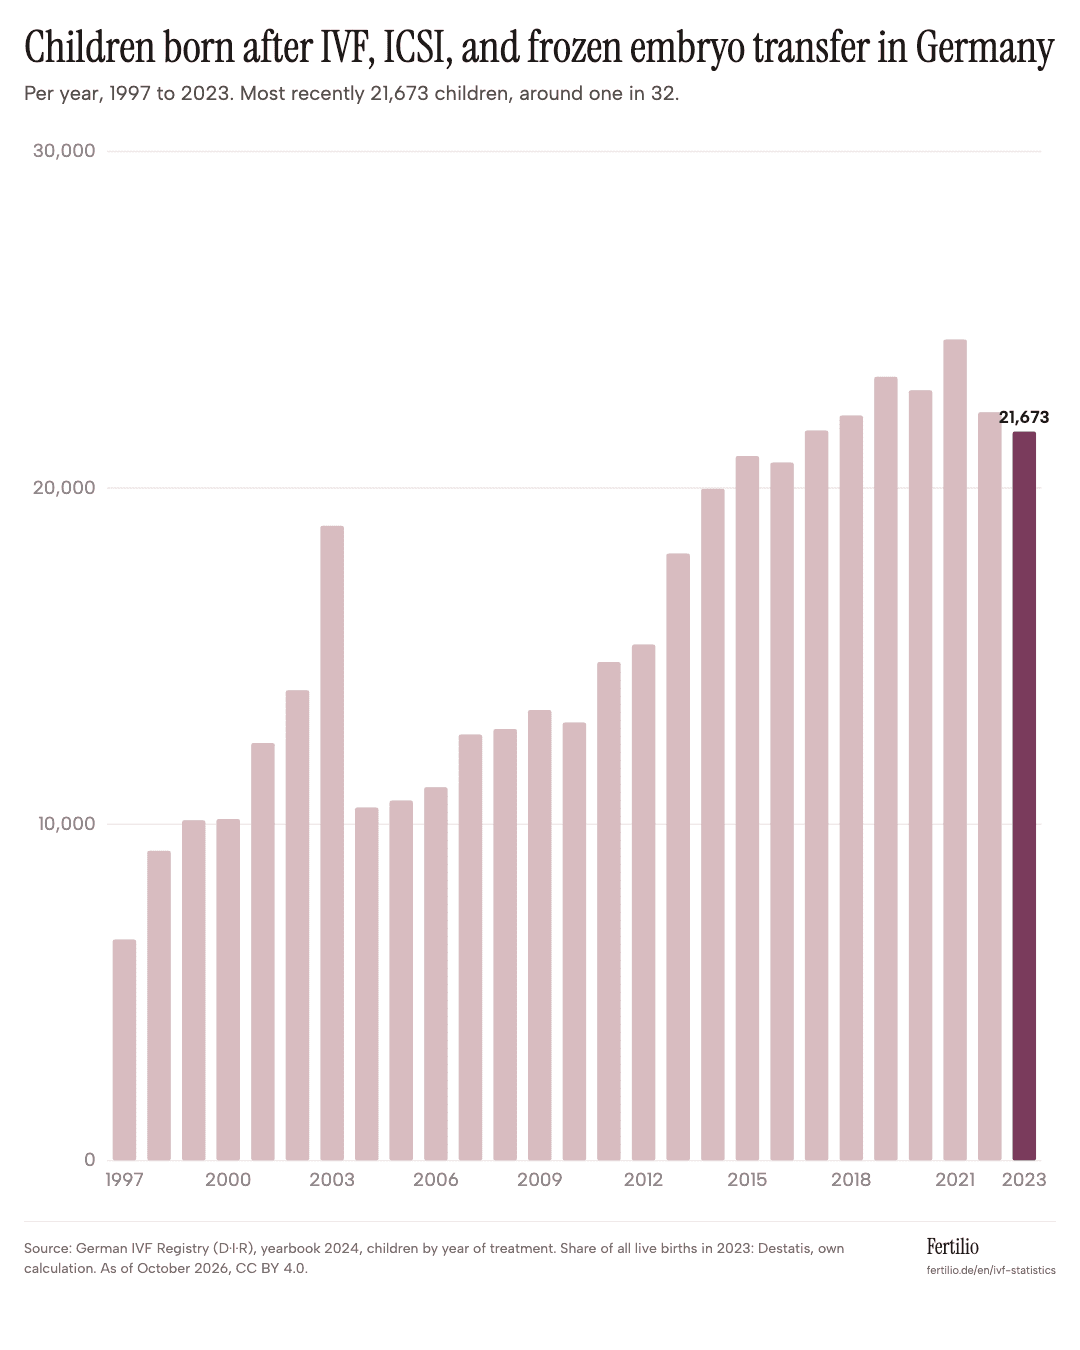
The share of twins has dropped sharply. In 1997, more than one in four children born after IVF or ICSI was a twin (1,902 of 6,577); in 2023 it was one in seven (3,132 of 21,673). The reason: fewer embryos are transferred today. In fresh cycles, the average was 2.56 embryos in 1997 and only 1.36 in 2023 (D.I.R. 2024). In Switzerland, the share of children born after IVF is similar to Germany's, at 3.2% (2024). Austria does not report a comparable share.
IVF treatments per year: record high in 2024 after the slump in 2004
In 2024, the clinics in Germany reported 131,801 evaluable (plausible) treatment cycles, more than ever before. A total of 134,281 were documented. The clinics treated 69,890 women, with 1.9 cycles on average. In 1997, there were only 30,676 cycles.
Treatment cycles in Germany per year
IVF, ICSI, and frozen embryo transfer, 1997 to 2024. Slump in 2004 after the health care reform, record of 131,801 in 2024.
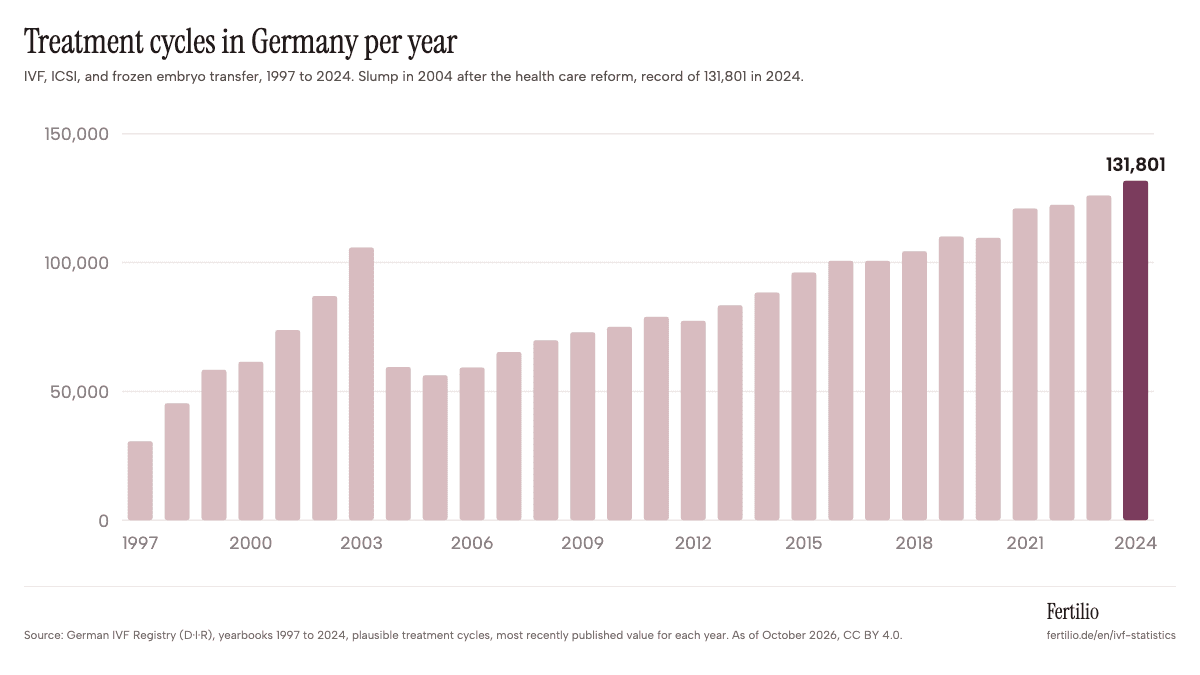
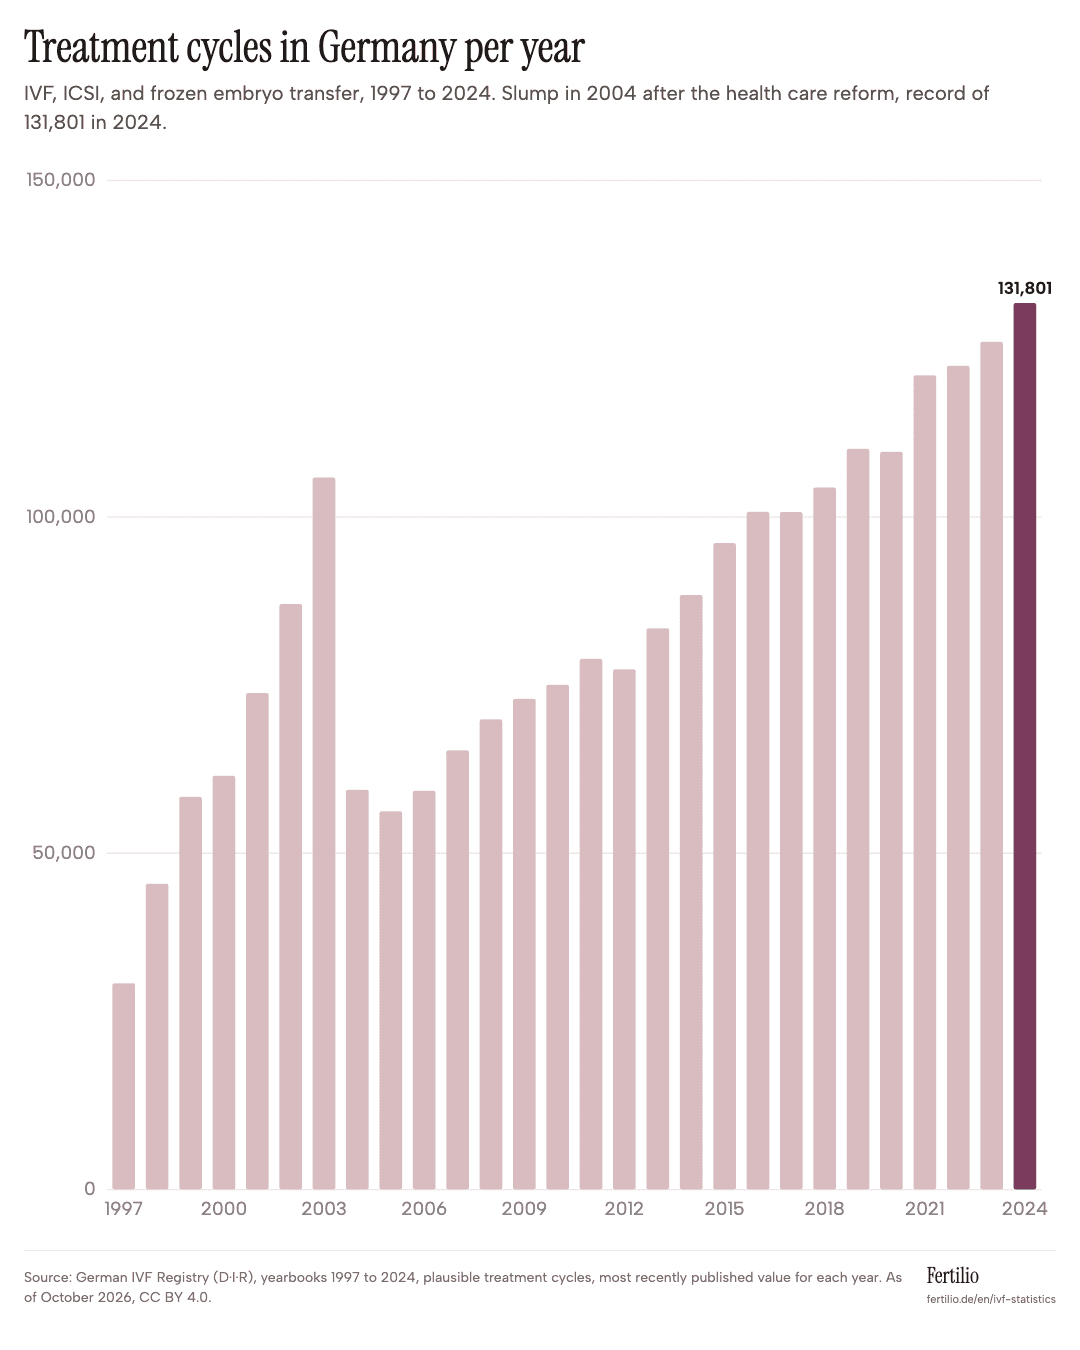
The sharp drop in 2004 has a political cause. With the Statutory Health Insurance Modernization Act (GKV-Modernisierungsgesetz, GMG), the statutory health insurance funds have paid only half of the costs since January 1, 2004 (Section 27a of Book V of the German Social Code, Sozialgesetzbuch V, SGB V), and the registry saw this as the reason for the slump (D.I.R. 2004). The number of cycles fell by 44% in the same year, from 105,854 to 59,448. It did not exceed the 2003 level again until 2019. Our health insurance comparison shows what insurance funds pay today and which ones cover more.
The chance per transfer falls markedly from the mid-30s on
For women aged 30 to 34, just over one in three embryo transfers in a fresh cycle led to a clinical pregnancy in 2023 (36% to 39%); for women aged 26 to 28, it was more than 40%. At age 38 it was 28.1%, at age 40 it was 23.1%, at age 42 it was 15.4%, and at age 44 it was 7.8%. At age 45 and older, the rate was 4.6%; of 462 transfers, two ended in a live birth.
Clinical pregnancy per embryo transfer by age
Fresh cycles with IVF and ICSI, Germany 2023. At age 30 38.3%, at age 40 23.1%.
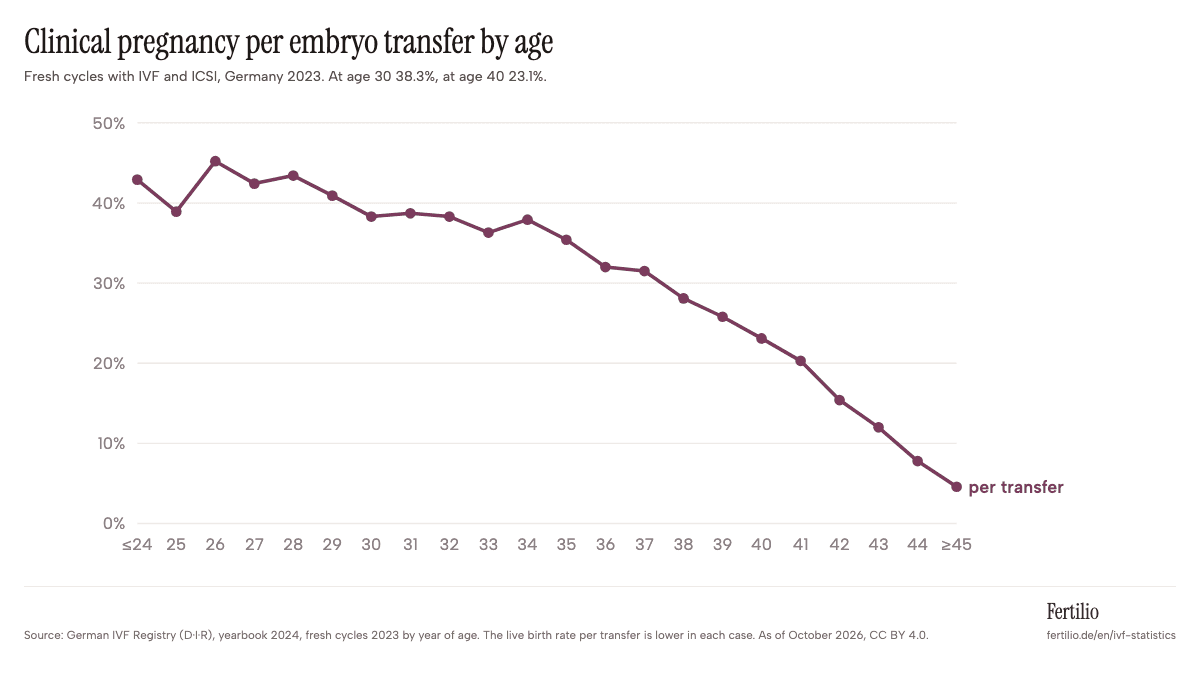
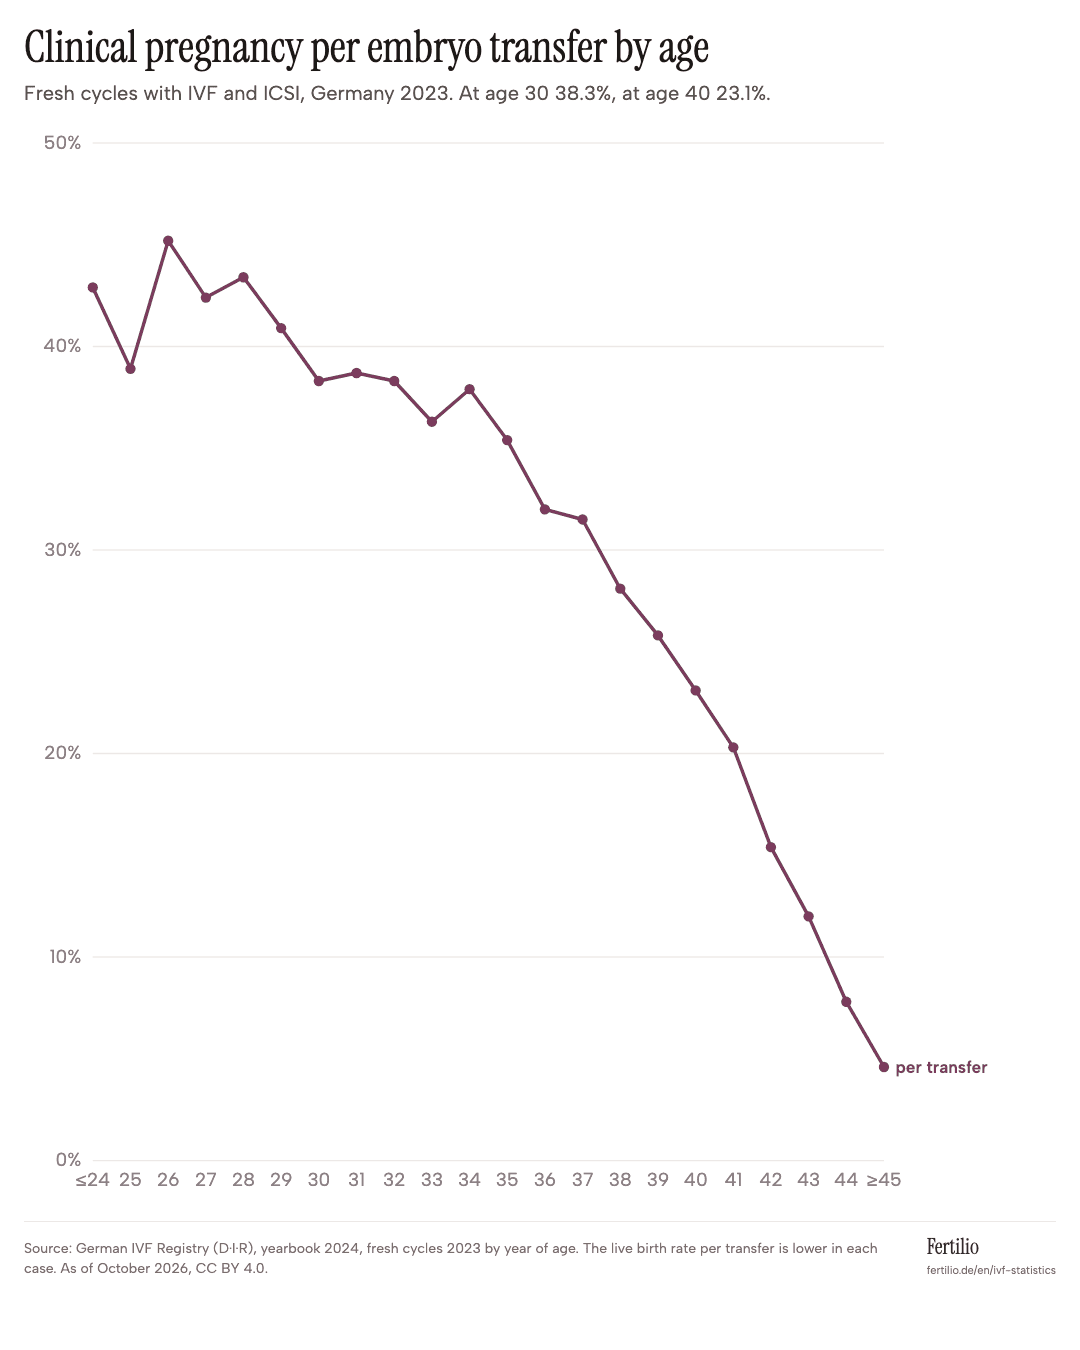
The values apply per transfer, not per couple. Over several transfers, the chances increase: among women whose first egg retrieval took place between 2018 and 2022, did not end in a freeze-all, and included additional freezing, 30.0% already had a live birth in the fresh cycle, and 54.8% overall after further thaw cycles (D.I.R. 2024). This applies to just over one third (36.8%) of these first egg retrievals; the value does not apply to everyone who is treated. The IVF Calculator estimates your personal chance based on age, AMH, and treatment, using the same registry data.
Germany, Austria, and Switzerland compared
Measured against the number of women aged 25 to 44, treatment is most frequent in Austria: 16.3 treatments with IVF, ICSI, or frozen embryo transfer per 1,000 women, compared with 12.7 in Germany and 10.1 in Switzerland. Funding differs greatly. In Austria, the IVF Fund covers 70% of the costs if there is a recognized indication, the woman is under 40, and the man is under 50 years old (a maximum of four attempts, only at contract clinics). In Germany, statutory health insurance pays half of the costs for up to three attempts for married couples (woman aged 25 to 39, man aged 25 to 49, Section 27a SGB V). In Switzerland, basic health insurance (Grundversicherung) does not pay for IVF, only for inseminations.
Fertility treatments per 1,000 women aged 25 to 44
IVF and ICSI including frozen embryo transfer, 2024. Germany, Austria, and Switzerland compared.
| Country | Treatments 2024 | per 1,000 women | Women treated per 1,000 | Avg. age of woman | Children after IVF | Coverage |
|---|---|---|---|---|---|---|
| Germany | 131,801 | 12.7 | 6.7 | 35.7 | 3.1% (2023, approximation) | Statutory health insurance 50%, married couples only, up to three attempts, woman aged 25 to 39, man aged 25 to 49 |
| Austria | 19,809 | 16.3 | 8.6 | 34.1 (ICSI in the IVF Fund) | not reported in a comparable way | IVF Fund 70%, woman under 40, man under 50, recognized indication, up to four attempts |
| Switzerland | 12,573 | 10.1 | 5.3 | 36.8 | 3.2% (2024, approximation) | Basic health insurance covers insemination only, IVF is self-paid |
Women in Switzerland are 36.8 years old on average at treatment, in Germany 35.7 years. For Austria, there are only values for the IVF Fund, which co-funds only treatments of women under 40: 34.1 years for ICSI and 33.8 years for IVF. The counting methods of the three countries differ; details are in the methodology.
Methodology
- Germany: Treatment cycles, children, age, and pregnancy rates from the D.I.R. Yearbook 2024 (data as of April 16, 2025) and, for the time series, from the yearbooks 1997 to 2023. The registry revises prior-year values; for each year, we use the most recently published value. Clinics per the D.I.R. member list (as of September 2026), births and population from the German Federal Statistical Office (Destatis).
- Austria: IVF and ICSI procedures in 2024 from the report under Section 21 of the Austrian Reproductive Medicine Act (Fortpflanzungsmedizingesetz), covering all treatments including privately paid ones and excluding insemination; average age from the 2024 IVF registry of the IVF Fund; clinics per the list of contracted facilities of the IVF Fund (Austrian Federal Ministry of Social Affairs, Sozialministerium, as of September 2026); population from Statistics Austria (Statistik Austria).
- Switzerland: Treatment cycles, treated women, children, and age from the Swiss Federal Statistical Office (2024); share of children born after IVF from the Swiss Federal Office of Public Health; clinics per the FIVNAT list of the SGRM (the Federal Office of Public Health cites about 28 clinics); population from the Federal Statistical Office.
- Country comparison: Germany counts plausible treatment cycles, Austria counts procedures, and Switzerland counts started cycles, in each case including frozen embryo transfers and excluding insemination. The German figure also includes 6,465 cycles in which only unfertilized eggs were frozen (including elective egg freezing and fertility preservation), as well as 5,358 cycles canceled before egg treatment or thawing. The Austrian report counts cancellations only after fertilization. Without these two groups, Germany would come to 11.6 instead of 12.7 treatments per 1,000 women.
- Our own calculations: We calculated the shares and the values per 1,000 or per million women ourselves. The number of women aged 25 to 44 is the sum of the official figures for each single year of age. The map uses the latest population figures (December 31, 2025, and January 1, 2026), and the country comparison uses the figures that match the treatment year 2024.
- Map: Borders simplified. Germany © GeoBasis-DE / BKG (2026), license dl-de/by-2-0, Austria based on Statistics Austria, Switzerland © swisstopo.
Using the charts and data
You may freely use all charts and data on this page, including in articles, presentations, and social media, under the CC BY 4.0 license. Please cite “Fertilio IVF Statistics” as the source, with a link to this page. Below each chart, you will find an image to download, a code snippet to embed, a direct link, and the data as a CSV file.
How to cite the data: Fertilio IVF Statistics, as of October 2026, https://fertilio.de/en/ivf-statistics/ (data: German IVF Registry, Destatis, Austrian National Public Health Institute, Austrian Federal Ministry of Social Affairs, Statistics Austria, Swiss Federal Statistical Office, Swiss Federal Office of Public Health, SGRM/FIVNAT).
Frequently asked questions
How many children are born in Germany after assisted reproduction?
For 2023, the German IVF Registry documented 21,673 children after IVF, ICSI, or frozen embryo transfer. That is about 3.1% of all live births in Germany, roughly 1 in 32 children. Since 1997, 433,858 children have been recorded in the registry.
How many IVF treatments are there in Germany per year?
In 2024, 131,801 plausible treatment cycles were reported (134,281 documented), more than ever before. Clinics treated 69,890 women, with 1.9 cycles per woman on average.
How many women have a baby after IVF?
Among women whose first egg retrieval took place between 2018 and 2022 and included additional freezing, 54.8% had a live birth after the fresh cycle and further thaw cycles (D.I.R. 2024). This value applies only to this group, which is just over one third of first egg retrievals. Per transfer, the chance falls markedly with age; see the chart above.
How old are women during fertility treatment?
In Germany, women are 35.7 years old on average and their partners 38.3 years old (2024). In Switzerland, women are 36.8 years old on average at IVF.
How many fertility clinics are there in Germany, Austria, and Switzerland?
In Germany, 142 fertility clinics are members of the German IVF Registry (as of September 2026, locations counted individually). In Austria, 27 healthcare facilities have a contract with the IVF Fund (as of September 2026); 36 are licensed under the Reproductive Medicine Act, and treatments took place in 33 of them in 2024 and 2025. In Switzerland, the FIVNAT list of the SGRM includes 32 IVF clinics, while the Federal Office of Public Health speaks of about 28.
What is the German IVF Registry?
The German IVF Registry (D.I.R.) collects the treatment data of German fertility clinics on IVF, ICSI, and frozen embryo transfer. Each year, it publishes a yearbook with cycles and with pregnancy and live birth rates. It has 142 member clinics (as of September 2026).
What is the chance of pregnancy per transfer?
In a fresh cycle, the clinical pregnancy rate per embryo transfer in 2023 was about 38% for women around 30, 23.1% at age 40, and 7.8% at age 44. The live birth rate is lower in each case.
Where does the cause of infertility lie?
In 38% of IVF and ICSI treatments in Germany in 2024, the cause lay with the man alone, in 26% with both partners, and in 24% with the woman alone (D.I.R. 2024).
Sources
- D·I·R Yearbook 2024, German IVF Registry (data as of April 16, 2025, published November 29, 2025)
- D·I·R Yearbooks 1997 to 2023 (archive), German IVF Registry
- Member clinics of the German IVF Registry, list as of September 2026
- Destatis, GENESIS-Online 12411-0013: Population by federal state, sex, and age in years (December 31, 2024 and December 31, 2025)
- Destatis, GENESIS-Online 12612-0001: Live births (2023)
- Austrian National Public Health Institute: report under Section 21 of the Austrian Reproductive Medicine Act (FMedG) 2024 (medically assisted reproduction)
- Austrian National Public Health Institute: IVF Registry annual report 2024 (IVF Fund)
- Austrian Federal Ministry of Social Affairs: list of contract clinics of the IVF Fund, as of September 2026
- Statistics Austria: population at the beginning of the year by age, sex, and federal state (January 1, 2025 and January 1, 2026, open data)
- Swiss Federal Statistical Office: Medically assisted reproduction in 2024 (tables T 14.03.07.01)
- Swiss Federal Office of Public Health: Monitoring of reproductive medicine, share of live births after IVF
- Swiss Society for Reproductive Medicine (SGRM), FIVNAT: list of IVF clinics
- Swiss Federal Statistical Office, STAT-TAB px-x-0102010000_101: Permanent resident population by canton, sex, and age
- D·I·R Yearbook 2004, German IVF Registry (on the Statutory Health Insurance Modernization Act)
- Section 27a of Book V of the German Social Code (SGB V): Assisted reproduction (coverage of 50% of the costs)
- VG2500 administrative areas, © GeoBasis-DE / BKG (2026), data simplified (dl-de/by-2-0)
- Federal state borders of Austria according to Statistics Austria (GeoJSON by ginseng666) (CC BY 4.0)
- swissBOUNDARIES3D cantonal borders, swisstopo (Open Government Data)
- Data License Germany, Attribution, Version 2.0 (License text)